


Did you know that 64% of consumers say they don’t share their experiences of good or bad customer service?
That’s a lot of silent customers.
The truth is, it takes considerable effort to establish exactly what you’re getting right and wrong when it comes to customer service. And that’s where customer service reports come in.
Customer service reports are dashboards that bring together multiple metrics so you can step back and see the big picture. But why are they so important and how can they improve your team productivity?

Benefits of Using Customer Service Reports
Operating a successful business means keeping an eye on all sorts of metrics. That’s because as well as giving you an insight into the overall health of the company, it helps you make decisions about the future.
Do you need to make broad, sweeping decisions about staffing levels? Or nail a software procurement task like finding an online proposal software for your business? It all comes down to understanding where you are in the moment.
Sometimes, the amount of data you need to track can appear a little overwhelming. On the customer-facing side, that’s where customer service reports come in. Using them makes it much simpler to:
- Meet data-based goals
- Understand your customers
- Increase team productivity
- Improve customer loyalty
You’ll be able to see any number of chosen metrics at a glance, which makes handling all that valuable data much more straightforward. So let’s have a look at some of the most useful customer service reports available at the moment.
5 Of The Most Useful Customer Service Reports
The reports you prefer to use will depend on your own circumstances. Some of these will be valuable on a day-to-day basis, whereas others you might only call on occasionally. All are worth checking out, but let’s start with the one most businesses will probably find consistently useful for monitoring productivity: the customer service team report.
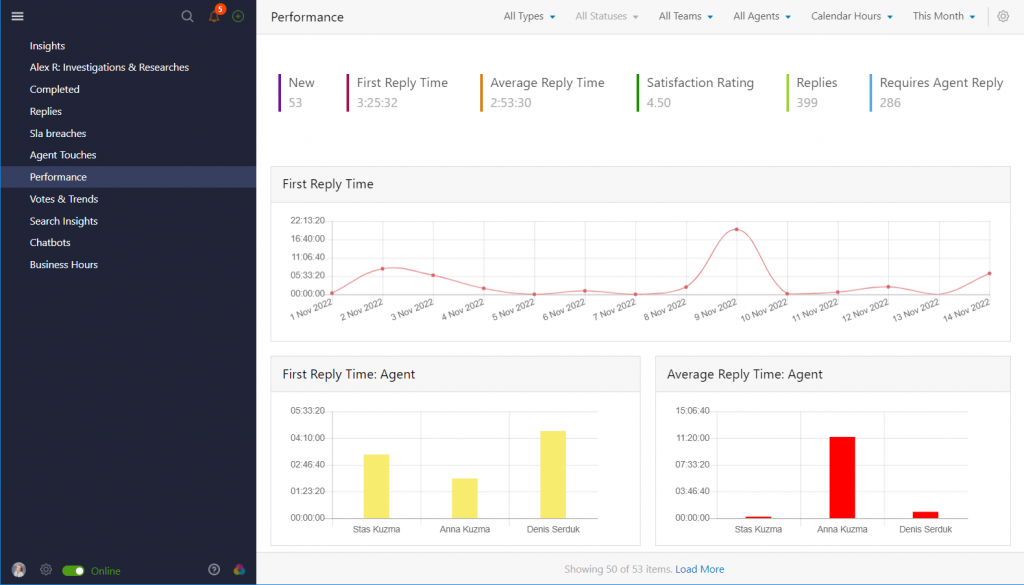
1. Customer Service Team Report
This gives you detailed information about how your team is performing. You can track all sorts of vital datapoints and use the insights obtained to identify your team’s weaknesses.
This is particularly valuable for improving productivity, because you’ll gain a clear idea of who might need more support to meet their goals and how you can help them. Key metrics you’ll find on the customer service team report include:
- Average response time: This is a standard metric for any kind of call-based customer service role. It measures the time elapsed between the customer making the call and the team member responding.
- Number of calls and tickets: Call volume is essential to track because you need to be able to schedule more staff to work during busy periods. You can’t do that if you don’t know when those are.
- First response time. This metric will show you how fast your support team is at reacting to customer requests.
- First call resolution: Customers prefer not to have to call twice (or even more!) to get an issue resolved. A high percentage here is a good sign.
- Top performers: Rewarding your top performers spurs them on. This information is also useful for identifying anyone who is struggling and might need a little more support.
- SLA breaches. See who of your agents and how often fail to meet the SLA agreement.
2. Customer Satisfaction Report
Getting a solid understanding of how your customers perceive the service you’re giving them is crucial. Without a clear idea of how satisfied your customers are, you won’t know where you should be focusing your efforts to improve. A customer satisfaction report will yield these tried and tested CSAT metrics.
- Net Promoter Score: This is calculated from how many more people give a high score than a low score when asked the question “Would you recommend our service to friends or family?”.
- Customer retention rate: It’s vital to track this over time so you can move fast to solve any issue driving customers away.
- Customer effort score: What’s it like trying to get through to your team and have an issue resolved? The customer effort score measures how much work your customers have to put in to get what they need.
3. Customer Retention Report
Sometimes you might want to delve deeper into the customer retention issue. If that’s the case, you can use a customer retention report to examine the finer details. At a glance you’ll be able to see:
- Churn rate: This is the percentage of customers who leave during a specified time period. Churn rates tend to vary by industry (e.g. people tend to change their clothes suppliers more readily than their bank). So you should be benchmarking this against your own standards over time and your direct competitors’.
- Revenue churn rate: This highlights how much revenue you’ve lost from existing customers during a particular period. It can go up if people are downgrading packages to save money, for example.
- Net retention rate: The net retention rate gives you more nuanced information about churn rates and how they relate to new vs. repeat customers.

4. Ticket-Level Report
To really focus on maximizing productivity and meeting customer expectations, consider a ticket-level report. This gives you granular data about support ticket volumes by channel. It covers phone calls, emails, live chat, social media support and so on.
It will give you a very detailed grasp of any problems with your customer support system that need to be addressed. Typical metrics you’ll find here are:
- Ticket volume: How many incoming support tickets are generated for the customer service team to handle.
- Time to close: The average time your team takes to resolve an issue.
- Open rate: The percentage of tickets open for attention during a particular time period.
- Escalation rate: The percentage of support requests that had to be escalated to senior colleagues for resolution.
5. Customer Service KPI Report
For analyzing individual performance, nothing beats a customer service KPI report. You can use it alongside customer feedback to obtain a rounded picture of how each agent is doing. Useful metrics featured in the KPI report include:
- CSAT score: This is the classic customer satisfaction score.
- Customer support vs. revenue: Calculates how much your customer support costs with respect to total revenue. The aim should be to provide high standards of service while keeping costs low.
- Service level: Measures your ability to meet the requirements of your service level agreement.
Supercharge Your Customer Service
Putting customer service and customer support first is a given. But there are right ways and wrong ways of going about it. Detailed customer service reports can make the job of analyzing where you stand a whole lot easier. That makes boosting team productivity and customer satisfaction much more straightforward.
What’s more, since a satisfied customer is a happy customer, that’s good news all round.